SplinterScope: Breaking Down My Season – What the Data Says About My Battles
Over the past season, I’ve again been collecting and analyzing my own Splinterlands battles using my custom-built analytics tool, SplinterScope. This tool automatically fetches data from the official Splinterlands Battle API and stores it in a local database. From there, it helps me track everything—from overall winrate and SPS earnings to card usage and performance by summoner or element.
This post is a full breakdown of my season. I’ll walk you through my battle results, share insights on what worked (and what didn’t), and highlight what I’m planning to change next season.
Overall Performance
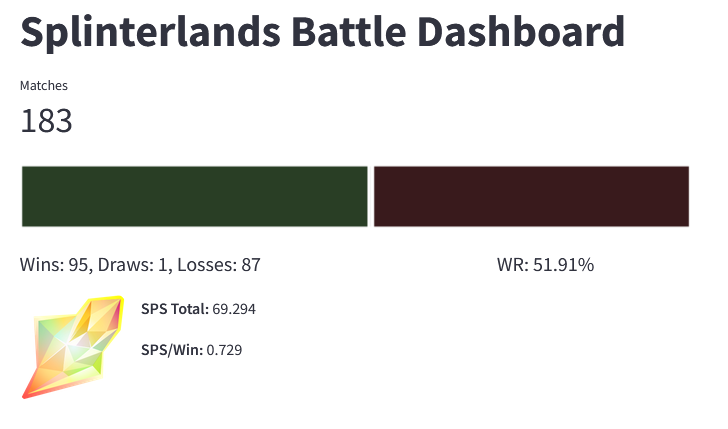
This season, I only played 183 matches, a noticeable drop from last season’s 262 due to time constraints. However, I managed to push my winrate above the 50% mark, which was one of my main goals – a big improvement over last season’s 45.8%. Despite the lower match volume, I still earned 69.294 SPS, which is only slightly below last season’s total. That shows how much efficiency matters – and that strategic adjustments can go a long way. For next season, I’m aiming to keep this momentum going while gradually ramping up my activity again.
Element Breakdown
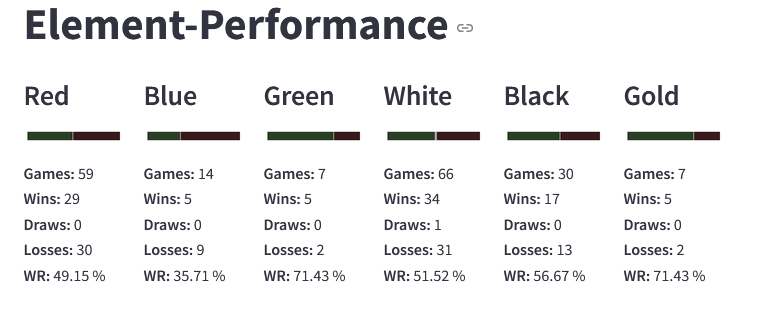
Next up, I analyzed my performance by element. The dashboard visualizes win, draw, and loss distribution for each splinter along with the winrate. The elements are named according to their respective color, as is the case in the raw data I receive from the API. I plan to change this in the future.
Please note that two-element summoners are always counted as the element displayed on the left-hand side of the card.
This season, I made a few deliberate adjustments based on last season’s stats – and it paid off. For example:
Fire (Red) and Life (White) were my most played elements this season, and both performed well. I focused on refining my strategies here and saw solid results.
Dragon (Gold) showed clear improvement – I used it more selectively and only when confident in the matchup, which helped stabilize its winrate.
Earth (Green) was barely used this time. After its poor showing last season, I decided to mostly shelve it for now.
Water (Blue) underperformed, largely due to a self-inflicted handicap: I didn’t rent a Level 2 summoner this season, which clearly impacted results. That’s something I’ll definitely fix next time.
Overall, the numbers support the strategic shifts I made – leaning into my strengths while avoiding previous pitfalls. I still see room for refinement, especially with Water and potentially revisiting Earth once my deck is better optimized.
Summoner Performance
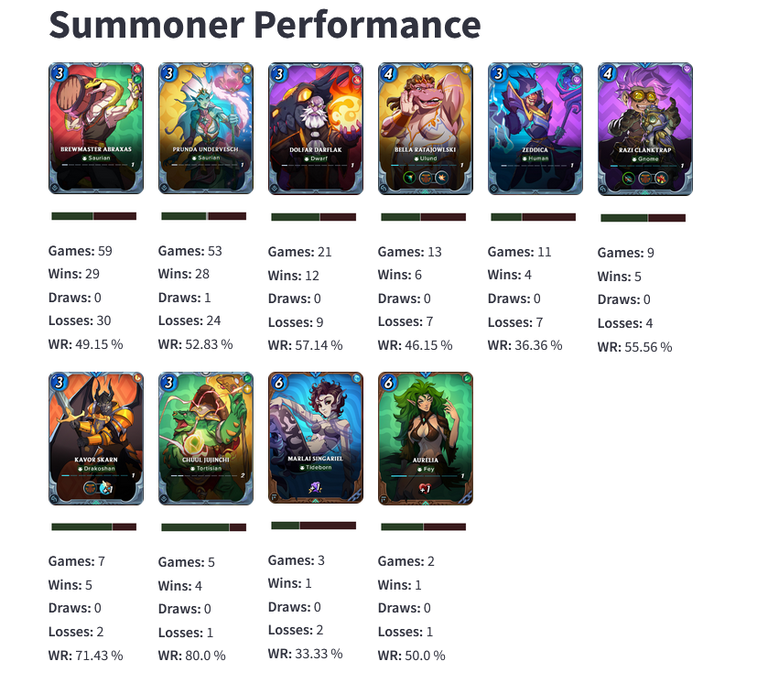
The Summoner performance section of the dashboard continues to be one of the most revealing parts of my analysis.
It tracks games played, wins, draws, losses, and winrates for each summoner I’ve used, offering a clear visual comparison across my roster.
This season, a few summoners stood out in particular:
Brewmaster Abraxas and Prunda Undervesch formed the backbone of my strategy. Both delivered consistently strong results and proved to be reliable picks across a variety of matchups.
Dolfar Darflak also performed well, showing dependable winrates when used, especially in the setups I’m most comfortable with.
The rest of my summoner pool was only used situationally, which means their sample sizes are small – but most of them still managed decent results. A few underperformed, but not to a worrying extent given their limited usage.
Looking ahead, I hope that Zeddica will return to form next season. If I can get her back at Level 2, I expect she’ll play a more central role again – especially if I can better integrate her into my main deck strategies.
Most Played Cards
The final section of the dashboard highlights individual card performance. The interactive table lists the top 30 most used cards, sortable by Usage, Wins, or Winrate.
To prevent misleading data, cards with fewer than 3% usage are excluded when sorting by winrate, so one-off games don’t skew the results. This view helps me identify cards that over- or underperform relative to how often I play them. I can't put a screenshoot here, because the table wont fit on my screen and I would have to scroll, but I want to share some insights I found:
- Overperforming Cards: Daigendark Surveyor (Water), Arachne Weaver (Death), Blackmoor Wild Elf (Earth) - 60%+ WR each and in top 30 of most played cards
- Underperforming Cards: Ujurak Brave (Death), Anachron Bolter (Life), Thanalorian Blade (Earth) - with a less than 33.33% WR each and in top 30 of most played cards.
- Most played cards: Halfling Refugee (Neutral) 83 Games, Bren Palesworn (Neutral) 63 Games, Emberguard (Fire) 49 Games
- Highest Winrate Card (with at least 7 (3%) games): Dark Arborist (Death) 100% Winrate
Final Thoughts & Feedback
Analyzing my gameplay with this tool has already helped me spot weak spots and plan my rentals more effectively for the next season. It’s also been incredibly satisfying to turn my data into visual, actionable insights.
That said, the dashboard is still evolving. I’d love your feedback:
- What do you think of my analysis?
- Do you agree with the conclusions I drew?
- What features would you like to see added to the tool?
Feel free to reach out with comments, suggestions, or ideas. Thanks for reading, and good luck in your battles!
I see a good system being built. 🍻