SPS (and Axie!?) Chart Watchers (Oct 28, 2021): Throwback Thursday

Hello again Chart Watchers!
Crypto tends to be fast paced, so a lot of people think there's always something exciting happening everyday. There are moments sure, but 80% of the time, nothing actually happens. As mentioned in our update yesterday, we have already identified the bullish and bearish conditions, so now we wait for SPS price action to play out. This downtime though is a good opportunity for us to try to look at other sources of data so we can see what's a potential way forward for SPS.
Throwback Thursday: The AXS Beginnings
Splinterlands may be 3+ years old, but SPS is barely 14 weeks. This is definitely good for all of us because we know we're VERY early, but it's also bad because we don't have historical data we can refer to to chart our way forward. Luckily, another play-to-earn has already gained prominence after being traded for 1+ years now. Let's see if we can find some nice AXS price action to see what potential scenarios may play out with SPS in the immediate future.
DISCLAIMER: I'm going to show you a couple of scenarios that played out during Axie's beginnings (almost the same period as now for SPS). It DOES NOT MEAN it will play out exactly. What's more important here is to learn how to spot breakout and breakdown patterns, so you can start understanding what SPS is going through and its similarities with other charts.
Breaking Out Of Broad. Desc. Wedges (1)

For the past 3 days, I've been talking about SPS being in a broadening descending wedge. One year ago, when Axie made an all time high price of 6.49 dollars, it began a correction to 3.31. Sound familiar? Look at the price action pattern that played out: a broadening descending wedge. How did it break to the upside? There was a break in the upper trend line, and it backtested it as support before moving on.
An important thing to note about this Axie chart: look at the RSI below. The RSI level where Axie started its bullish run to 6.49 was the same level where its bearish correction found support before moving upwards again.

Now let's look at SPS. The broadening channel started at 94 cents before correcting all the way down to 48 cents, very similar to the % correction for Axie. And look at the RSI for SPS: it's back to the same level as it was when we began our meteoric rise to 1 dollar.
Does it mean we've found the bottom? Who knows. We can only really confirm it when price breaks the upper trend line.
Breaking Out Of Broad. Desc. Wedges (2)
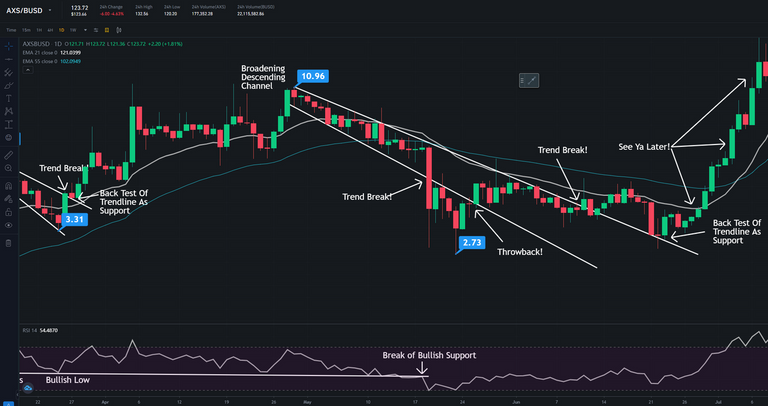
Right after the 3 dollar correction for Axie, it then went on another bullish run to create another all time high, this time at 11 dollars. What did it do right after? Form ANOTHER broadening descending channel. This is a better example because it shows us that just because you're in that channel doesn't mean you'll stay there. When price falls off the channel, it can fall HARD. Luckily for AXS, it bounced back rather quickly, got back into the channel, and how did go back on an uptrend? Break the upper trendline, backtest the trendline as support, and said "see ya later!" to all its bears.
Whew! All this talk about wedges make me sound like a broken record at this point. :D But I do hope that you're learning more and more about how to read price action.
That's all for today everyone! Stay safe, and HODL strong!
_________________________________
Like what you see? Upvote and follow me for constant updates on SPS! Thank you all!