🚜 Weekly Land Migration Update – Making Moves!

New week, new update on the big land migration from Python to Next.js.
Honestly? It’s been a smoother week than I expected… I had planned to move just one or two tabs over, but surprise surprise — I ended up migrating four tabs! 🥳
Super happy about that.
And just to give a little context — it’s not always just copy-paste and move on. Every screen I touch gets a bit of a review: Was this the right decision back when I built it in Python? Sometimes the answer is “uhhh nope,” and then I fix it.
One cool thing that happened this week: while I was working on the Resource Supply screen, @doombot75 asked about the missing SPS stats. That was actually intentional at the time... but his question made me realize I also forgot to account for SPS as a consumed resource. Whoops 😅
So that’s now fixed — thanks for the nudge, doombot!
👉 Don’t want to read the rest and just want to click around?
Check it out here:
🔗 https://next-land.spl-stats.com/
✅ What’s New This Week?
All resource tabs have been migrated! That means we now have:
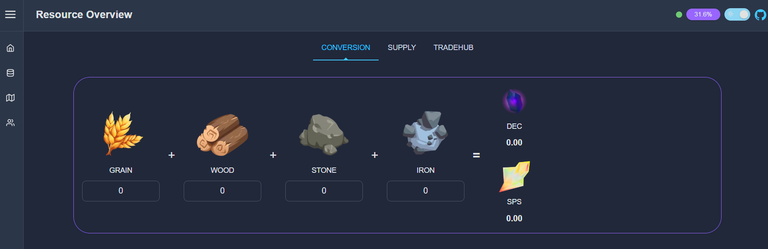
🔁 Conversion Tab
See how much DEC/SPS it would cost to convert from one or more resource to DEC/SP.
📈 Grain Factor Chart
Back again, one of my favorites!
I also added the USD price for DEC to give more context — could be useful when planning for liquidity pools.
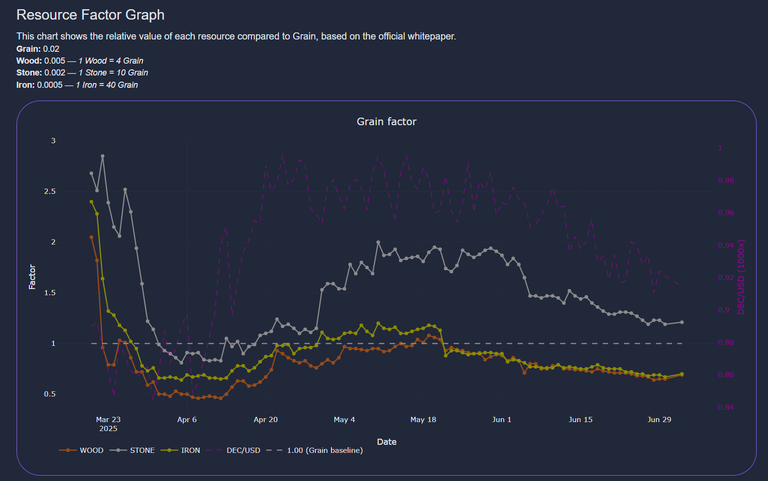
Check out @azircon's post on that topic for more insights:
🔗 Understand the asymmetric risk
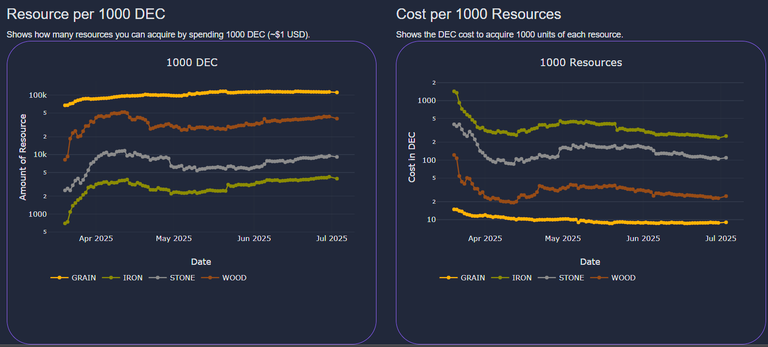
💰 DEC & Resource Value Charts
- “What can I get with 1 USD (1,000 DEC)?”
- “How much does 1000 of a resource cost?”
Always fun to see those comparisons.
🧮 Improved Supply Overview
This tab got a big upgrade.
- Now includes Trade Hub data — way more accurate snapshot of total supply.
- Added SPS consumption, which is crucial for tracking actual resource use.
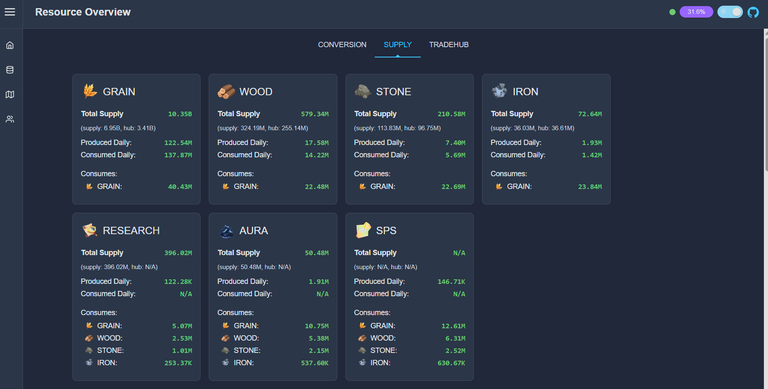
⚠️ Heads up: I’m not 100% sure the daily SPS production number is accurate. If anyone knows the real value (maybe @clayboyn?), let me know so I can update it.
As always, you’ve got the classic charts here too:
Daily production - Daily consumption
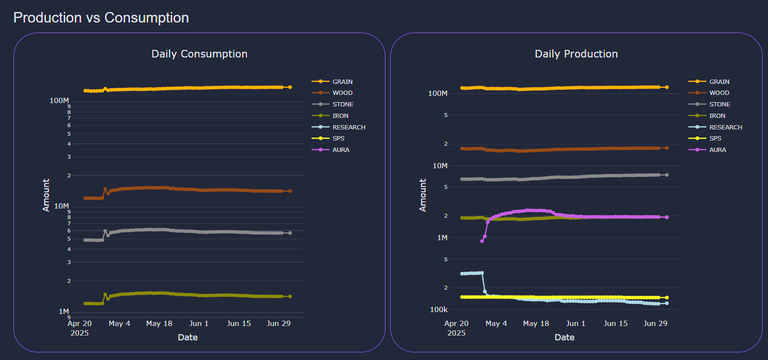
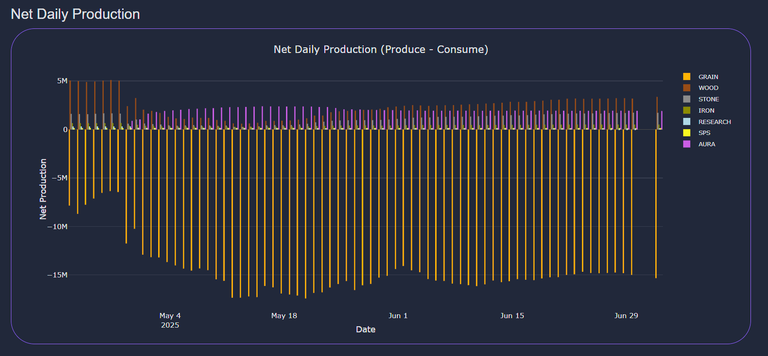
Net production (my favorite – always cool to see what’s stockpiling vs. draining)
📊 Trade Hub Page
Tracks:
- Estimated DEC burn per trade
- Cumulative burn over time
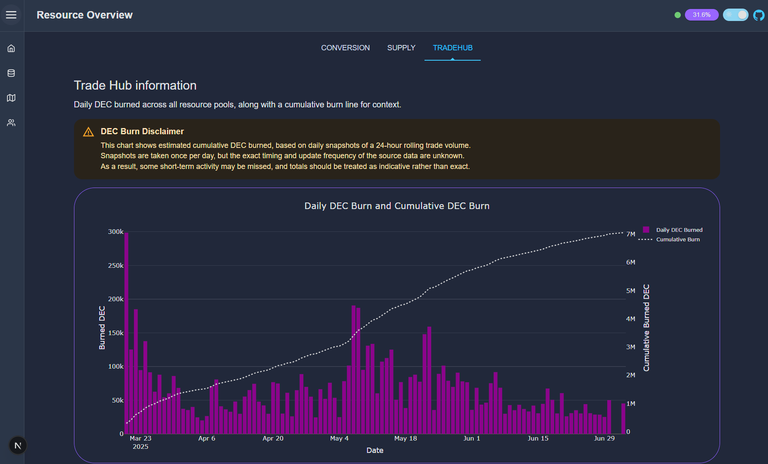
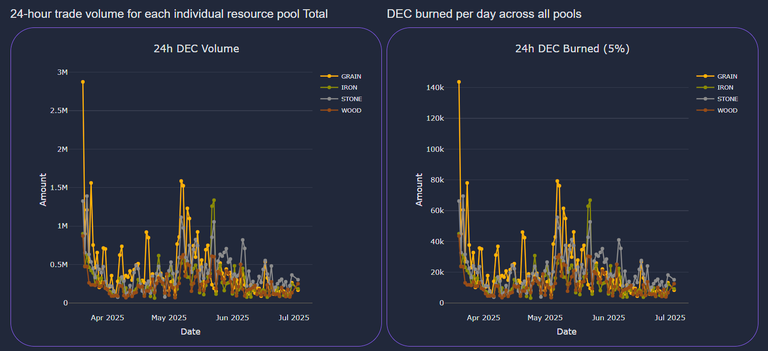
- Daily resource trading volume
Super handy if you're trying to wrap your head around liquidity pools and AMM mechanics (still learning myself 😅).
🗺️ Region Overview – Activity Tab
Wasn’t even on the roadmap this week, but I managed to sneak it in!
Shows:
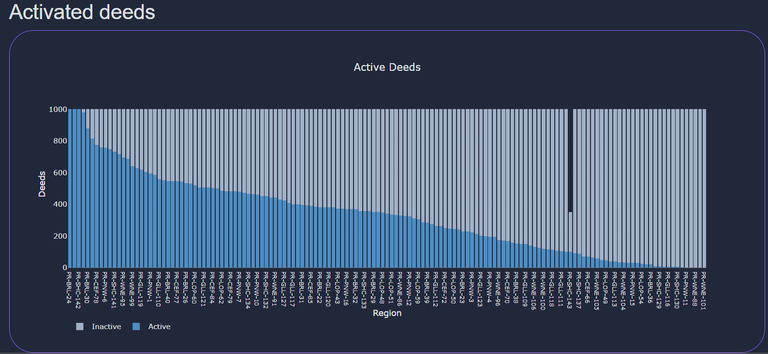
% of land that's active
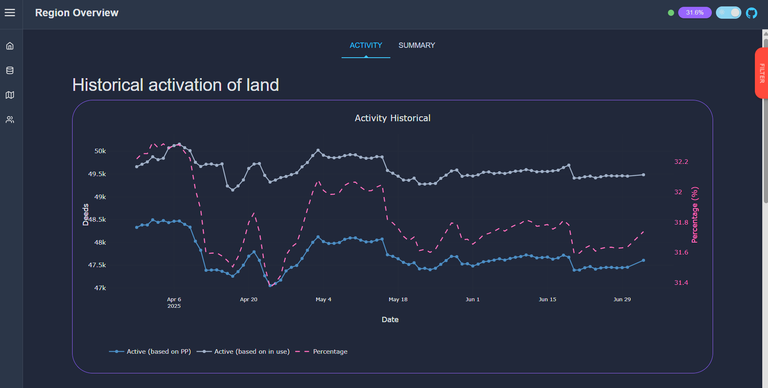
Sadly, still hovering around ~32% active land. We’ll keep watching this as more resource sinks are released.
What resource each active plot is working on
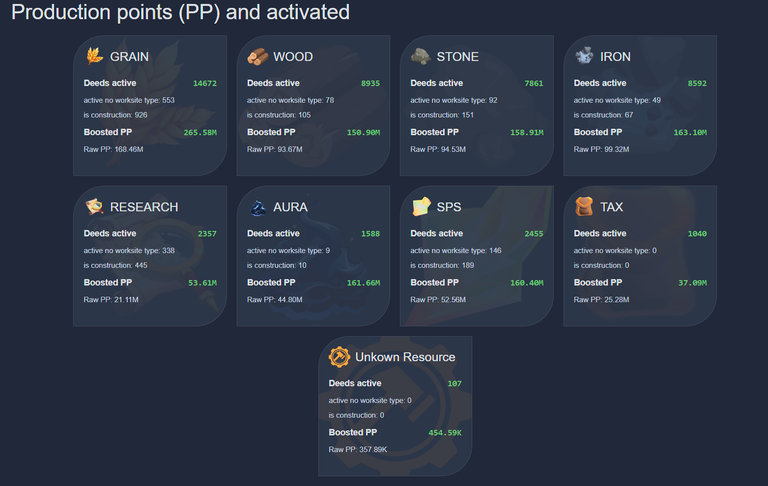
Small extra here: I added “is under construction” info to the production point cards. Important note — a plot with 0 PP that's under construction will always appear as under construction.
Also found a funky bug: some plots say they produce GRAIN, but are actually supposed to produce WOOD, etc. These are plots that haven’t been transformed yet since the 1.75 update. Heads up!
🧪 Want to See the Code?
🔍 GitHub Repos (If You Dare):
🐍 Python version
⚡ Next.js version
PRs, issues, or just general “what in the spaghetti is this?” reactions welcome — be kind 😅
🙌 Support the Project
✅ Upvote this post – it really helps!
👉 Vote for My SPS Validator Node
💬 Drop a comment or idea – weird edge cases welcome.
⚠️ Final Note
Still just a fun hobby project — built during late-night, caffeine-fueled coding sessions. If something breaks… ping me. I’ll fix it. Eventually. 😂
Stay awesome, and keep farming that land! 🌾
Thanks for the mention, surprising how much the effect of consumption of resources for SPS has, we are a lot closer to reducing inflation of resources than i thought, if wagons (hopefully we find out about before the influencer town hall on Tuesday) use a bit of iron and wood then it could be even closer!
As usual all your work is appreciated!
Exactly... we shouldn’t wait too long to introduce use-cases for the other resources, or we’ll end up with the same oversupply issue that grain is facing right now! 🤣
I have been messing around with a chart showing resource flow as a bit of fun and the final missing piece is where Aura goes, is there anywhere in the API that i could find daily consumption of Aura by use? as more use cases become available it would be nice to visualise it all flowing through the system (for me anyway :) )
Very nice chart! 😍
It’s definitely tricky to determine actual aura consumption, but here’s one possible approach:
Aura Consumed = (Previous Day's Total) + (Production) - (Current Day's Total)
It’s a rough method, but it should give a solid approximation!
Again, awesome work on the chart—next step: full Land 2.0 flowchart? 🤣
was hoping we would get the sawmill for wagons... maybe next conflicts!
I think implementing refined resources is hard and will take a while to implement i guess... hope @cryptomancer can surprise us.
And it will definitely lead to some headaches in my current tool 🤣
Thanks for sharing! - @azircon

What can I say, a very valuable update. Pool data integration was much needed!
Okay but that funky bug with grain vs wood plots? I literally laughed because I’ve seen that and thought I was going crazy. 😂 Thanks for confirming I’m not alone.
https://x.com/jewellery_all/status/1942205874766045615
#hive