RE: LPE and ROI - UNITE!
You are viewing a single comment's thread:
LPE is just a metric. It will still generate a number
Land Plot Efficiency (LPE) = (Total DEC Equivalent generated/hr) / (Number of active Plots)
It is priced in DEC. It doesn't care what happens to DEC. It does care about price of resources, if their value drops drastically, which can happen if people stop producing all resources, and keep selling them (I don't know why they would do that) then LPE goes up.
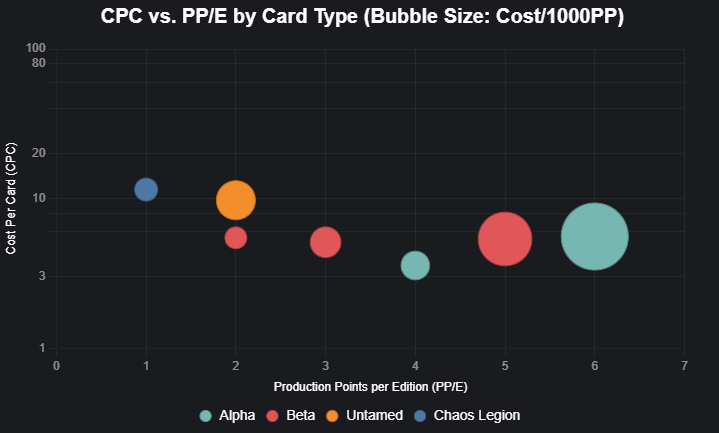
Anyways, I think a bubble chart could be better visually
0
0
0.000
Exactly my point. While my calculations are tied to DEC/$ Ratio, your's are tied to DEC/Resource ratio. I just hope that neither gets down :-D
And the LPE would go up? Doesn't it mean that less DEC is produced per plot, and it goes down?