Win As You Fall, Win As You Rise ...

The majority of cryptocurrency investors do not trade daily. They generally prefer medium and long term investments. This is because cryptocurrency markets are volatile. But he knows this very well; If the cryptocurrency it invests in responds to a down-to-earth problem, it rises…
At this point, I want to ask you the following question… ?
Is it possible to multiply your cryptocurrencies … ? I think it's possible, but how…?
Let's start …
I am not going to tell you about the passive income possibilities…. Lending, Staking, … no.
We'll just have a little bit of courage and some basic technical analysis tools...
Let me tell you from the start; if you will be stressed in every step you will do, if you do not know how to learn after every mistake, Please do not read the rest of the article … This article is not for you …
Now that we've got the guts out of the way, let's learn basic technical analysis...
Support and Resistance Lines
Support Line; It is the price level at which the falling price clings, the sellers are reluctant, the buyers are willing to buy, in short, the demand is above the supply.
Resistance Line; It is the price level that the rising price has difficulty passing, buyers are reluctant to sell, and sellers are willing to sell, in short, the supply is above the demand.
Support and resistance points are derived from historical price charts. The more you try the points determined as support and resistance, the stronger they are.
What do we mean … Let's explain with graphics …
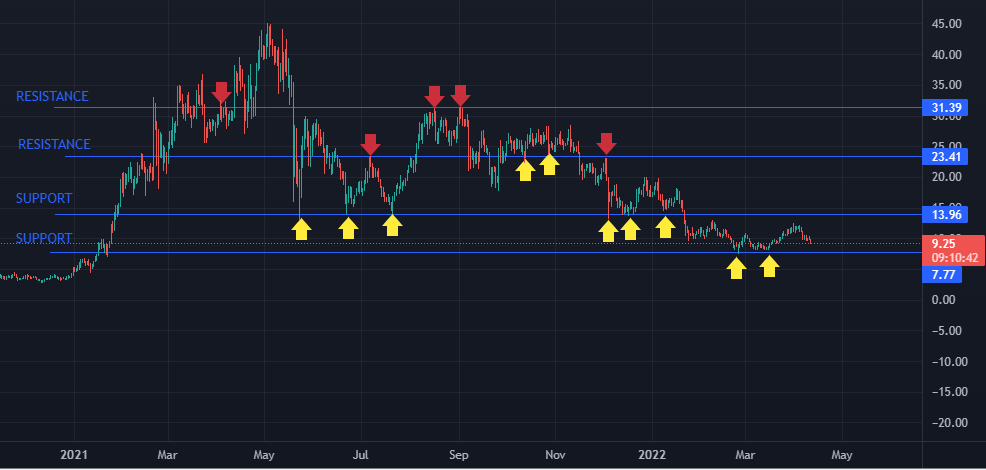
The more points the Support or Resistance lines intersect, the stronger it is.
Moving Average; It is a price-based, lagging (or reactive) indicator that displays the average price of a security over a period of time. Besides measuring momentum, the Moving Average is a good way to confirm trends and identify areas of support and resistance. Basically, Moving Averages soften the "noise" when trying to interpret charts. Noise consists of both price and volume fluctuations. Since the Moving Average is a lag indicator and reacts to events that have already occurred, it is not used as a forecast indicator, it is an interpretative indicator used for confirmation and analysis. In fact, it forms the basis of other well-known technical analysis tools such as Moving Averages, Bollinger Bands, and MACD.
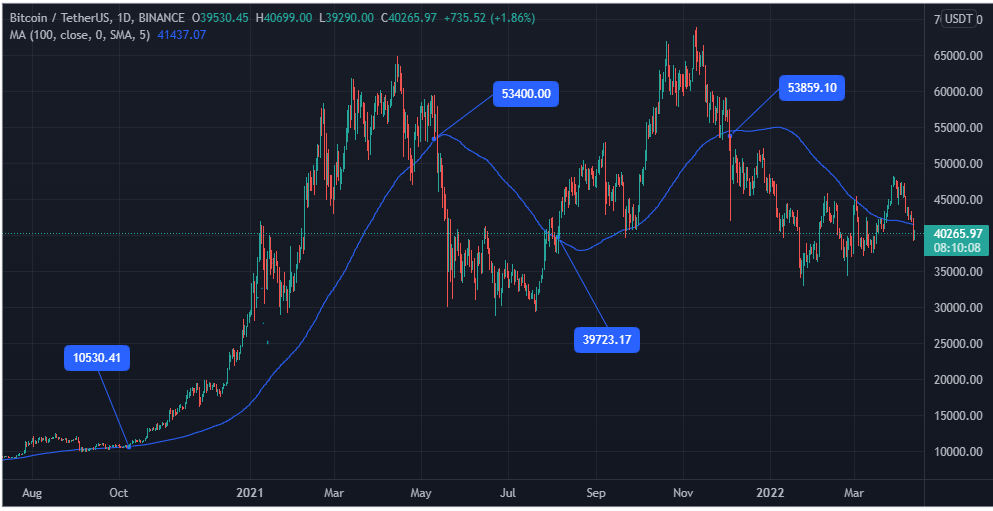
I usually use the 100-day moving average on the daily price chart. But it may not apply to all cryptocurrencies. Decide which of the daily moving averages between 50 - 120 is appropriate on the daily chart of the cryptocurrency you want to examine.
Look at the entry-exit points on the chart. Use the moving average that gives a result similar to this one.
** How to confirm support and resistance and moving averages;** One-day closing or 3 4-hour closing makes it easy for you to decide.
My Last Words; As you can see, you can multiply your cryptocurrencies in two simple ways. Buy at support, sell at resistance. Considering the moving average... You should place your stop orders slightly below the support and slightly above the resistance... Please click for information about the stop order...
I wish everyone good luck...
Posted Using LeoFinance Beta