Weekly Statistics For The $SPT Token
Weekly Statistics For The $SPT Token
Hello friends of $SPT, Friends of $HIVE and all others,
here are the:
$SPT Statistics For The Last Week:
The timeframe is from 2023-07-28 to 2023-08-04.
Bought $SPT By Time
This figure shows who has bought how many $SPT at which time:

Top $SPT Buyers And $HIVE Sellers
The inside of the circle shows the buyers of $SPT, ordered by $HIVE they have spent. The outside shows the recipients of that $HIVE (sellers of $SPT):

Commulated Amount Of Bought $SPT Per Person
This figure shows the top 10 $SPT buyers, how much they got and how much $HIVE they spend for this. It is sorted by $HIVE, that was spent:

Table Of Top 20 $SPT Buyers
This table shows the top ten buyers of $SPT sorted by the $HIVE, they have spent:
| Buyer(Descending) | Sold $HIVE | % Sold $HIVE | Bought $SPT | Avg. Price | Number of Trades |
|---|---|---|---|---|---|
| @mxnsmxn | 60.37322 | 35.33 % | 128394.13920 | 0.00047 | 129 |
| @byebye | 57.02150 | 33.37 % | 121948.57141 | 0.00047 | 32 |
| @bronkong | 19.60001 | 11.47 % | 40000.02930 | 0.00049 | 22 |
| @bdvoter | 9.08807 | 5.32 % | 19343.71615 | 0.00047 | 19 |
| @cryptictruth | 9.04680 | 5.29 % | 15996.87146 | 0.00054 | 5 |
| @stimp1024 | 4.66997 | 2.73 % | 9936.11230 | 0.00047 | 1 |
| @pravesh0 | 4.08132 | 2.39 % | 7288.46130 | 0.00056 | 6 |
| @atnazo | 3.97100 | 2.32 % | 8354.18980 | 0.00048 | 2 |
| @mcbot | 1.68100 | 0.98 % | 3397.15496 | 0.00054 | 10 |
| @cryptovisitor | 0.85617 | 0.50 % | 1605.58968 | 0.00049 | 9 |
| @fjworld | 0.47125 | 0.28 % | 999.99997 | 0.00047 | 2 |
| others | 0 | 0.00 % | 0 | 0.00000 | 0 |
| Sum: | 170.86031 | 100 % | 357264.83553 | 0.00055 | 237 |
Commulated Amount Of Sold $SPT Per Person
This figure shows the top 10 $SPT Sellers, how much they sold and how much $HIVE they got for this, sorted by $HIVE:

Table Of Top 20 $SPT Sellers
This table shows the top ten sellers of $SPT Sorted by the $HIVE, they have got:
| Seller(Descending) | Earned $HIVE | % Earned $HIVE | Sold $SPT | Avg. Price | Number of Trades |
|---|---|---|---|---|---|
| @mcbot | 67.31939 | 39.40 % | 140550.78343 | 0.00049 | 7 |
| @burlarj | 9.56103 | 5.60 % | 20745.49316 | 0.00046 | 2 |
| @alokkumar121 | 8.81497 | 5.16 % | 19078.01855 | 0.00046 | 2 |
| @dswap | 5.86011 | 3.43 % | 12447.52989 | 0.00047 | 7 |
| @byebye | 5.59509 | 3.27 % | 9815.94620 | 0.00057 | 3 |
| @mango-juice | 5.49227 | 3.21 % | 11646.12811 | 0.00048 | 8 |
| @gank | 4.57355 | 2.68 % | 9788.50391 | 0.00047 | 4 |
| @queenstarr | 4.22519 | 2.47 % | 8975.61890 | 0.00047 | 2 |
| @zaibkang | 4.15952 | 2.43 % | 8829.75000 | 0.00047 | 1 |
| @yonilkar | 3.97036 | 2.32 % | 8352.84180 | 0.00048 | 1 |
| @arcange | 3.68934 | 2.16 % | 6588.33691 | 0.00056 | 1 |
| @libertycrypto27 | 3.58733 | 2.10 % | 7472.40752 | 0.00051 | 4 |
| @zallin.spt | 3.49465 | 2.05 % | 7417.03100 | 0.00047 | 31 |
| @martina-sigulin | 3.43456 | 2.01 % | 7290.82202 | 0.00047 | 2 |
| @mercurial9 | 3.32250 | 1.94 % | 7069.00195 | 0.00047 | 1 |
| @elderdark | 3.05150 | 1.79 % | 6541.43347 | 0.00047 | 3 |
| @mein-senf-dazu | 2.10455 | 1.23 % | 4461.63574 | 0.00047 | 1 |
| @trep2 | 2.03398 | 1.19 % | 4320.43713 | 0.00047 | 2 |
| @libertygame27 | 1.92807 | 1.13 % | 4136.06738 | 0.00047 | 1 |
| @cryptoyzzy | 1.91431 | 1.12 % | 4072.91528 | 0.00047 | 1 |
| others | 22.72808 | 13.30 % | 47664.13318 | 0.00049 | 153 |
| Sum: | 170.86035 | 100 % | 357264.83553 | 0.00049 | 237 |
Price Of The $SPT
This figure shows the price of $SPT for the last period:

$SPT Summarize Metrics
This table shows how much $HIVE was given by buy-requests, that where equal or higher than the sell order vs. sell-requests, that were equal or lower than the buy order.
If the buy-requests where higher than the sell-requests, then money comes into the system and the value of the token increases.
Under the total line one can see the sum of $HIVE and sum of $SPT that changed the ownership and the average price of $SPT for the last period.
| Request | Received Hive | Received HIVE % | Sold $SPT | Avg. Price |
|---|---|---|---|---|
| sell | 151.67462 | 88.77% | 320368.64476 | 0.00047 |
| buy | 19.18570 | 11.23% | 36896.19078 | 0.00052 |
| sum: | 170.86032 | 100% | 357264.83554 | 0.00049 |
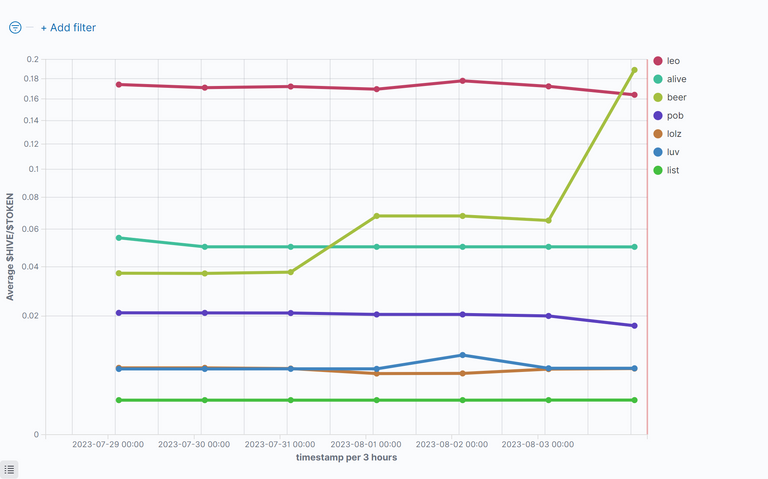
Comparison With Other Tokens
$HIVE/Token
This figure shows the value of $HIVE compared to some token for the last period. Be aware of the nonlinear (root square) y-axes.
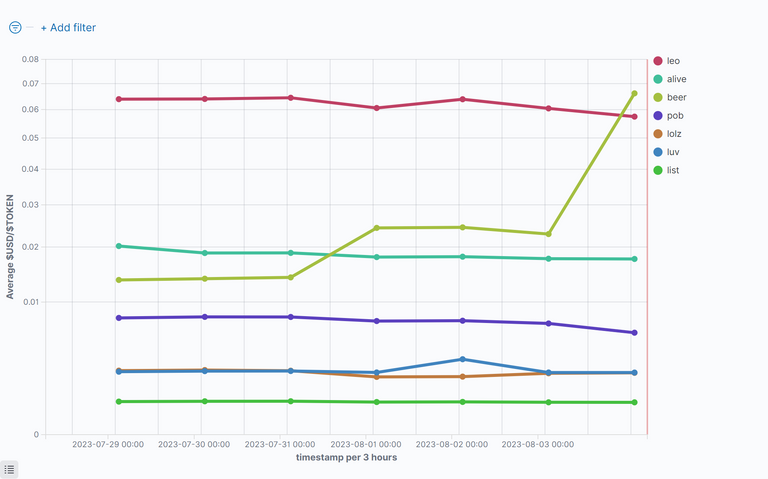
US-Dollar/Token
This figure shows the value of $USD compared to some token for the last period. Be aware of the nonlinear (root square) y-axes.
The HIVE rank in Coinmarktecap is: 148
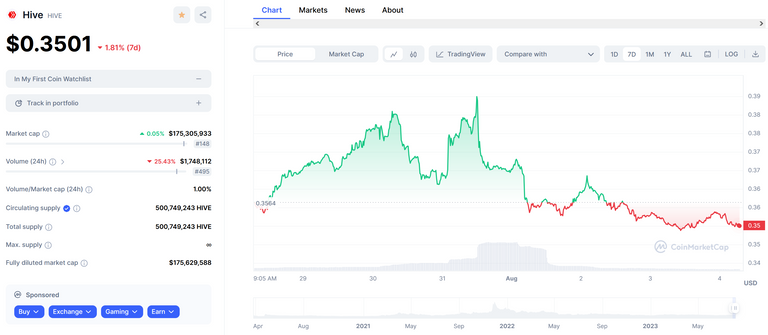
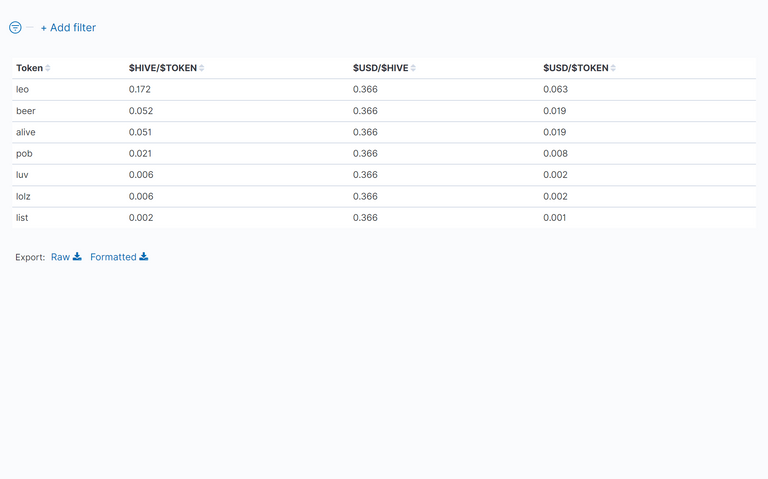
Table Of Token Prices in $HIVE and $USD
This table shows the average value of the prices of the token for the last period. One can see Hive and the US-Dollar compared to the token.
Disclaimer
All stats are without warranty.
They are taken from:
curl -XPOST -H "Content-type: application/json" -d '{ "jsonrpc": "2.0", "method": "find", "params": { "contract": "market", "table": "tradesHistory", "query": { "symbol": "TOKEN"}, "limit":1000, "offset": 0 }, "id": 1 }' 'https://api.hive-engine.com/rpc/contracts'
I have put them into logfiles and uploaded them to Kibana, from which I took the screenshots.
If you find errors, please tell me!
If you want me to continue the stats, give me some good upvotes ;-)
If you want to see other statistics (even from totaly other data), please contact me. I can create them weekly or monthly if I get some rewards for it.
For more details see here: How I Have Set Up Elasticsearch And Kibana On My Raspberry Pi To Monitor Token Activities and here: Do You Want To See Statistics Of Your Favorite HIVE Token? or on github.
Here are the stats from the other tokens I observe: https://peakd.com/@achimmertens/posts?filter=stats
Remark
All the Hive and HivePower, which is generated with this post, goes to @anobel. He donates the Hive to people that do good things and post about it.
You may follow him and support his work. See his latest post:

Regards, Achim Mertens